> ## Documentation Index
> Fetch the complete documentation index at: https://docs.flashquotes.com/llms.txt
> Use this file to discover all available pages before exploring further.
# Reports
> Analyze business performance with powerful reporting and visualization tools
## Overview
The Reports dashboard provides comprehensive analytics and insights into your business performance. Track revenue, monitor service utilization, analyze customer behavior, and identify trends to make data-driven decisions about your business.
 ## Accessing Reports
Navigate to **Reports** from the main navigation menu to access your analytics dashboard.
## Available Reports
### Service Asset Utilization
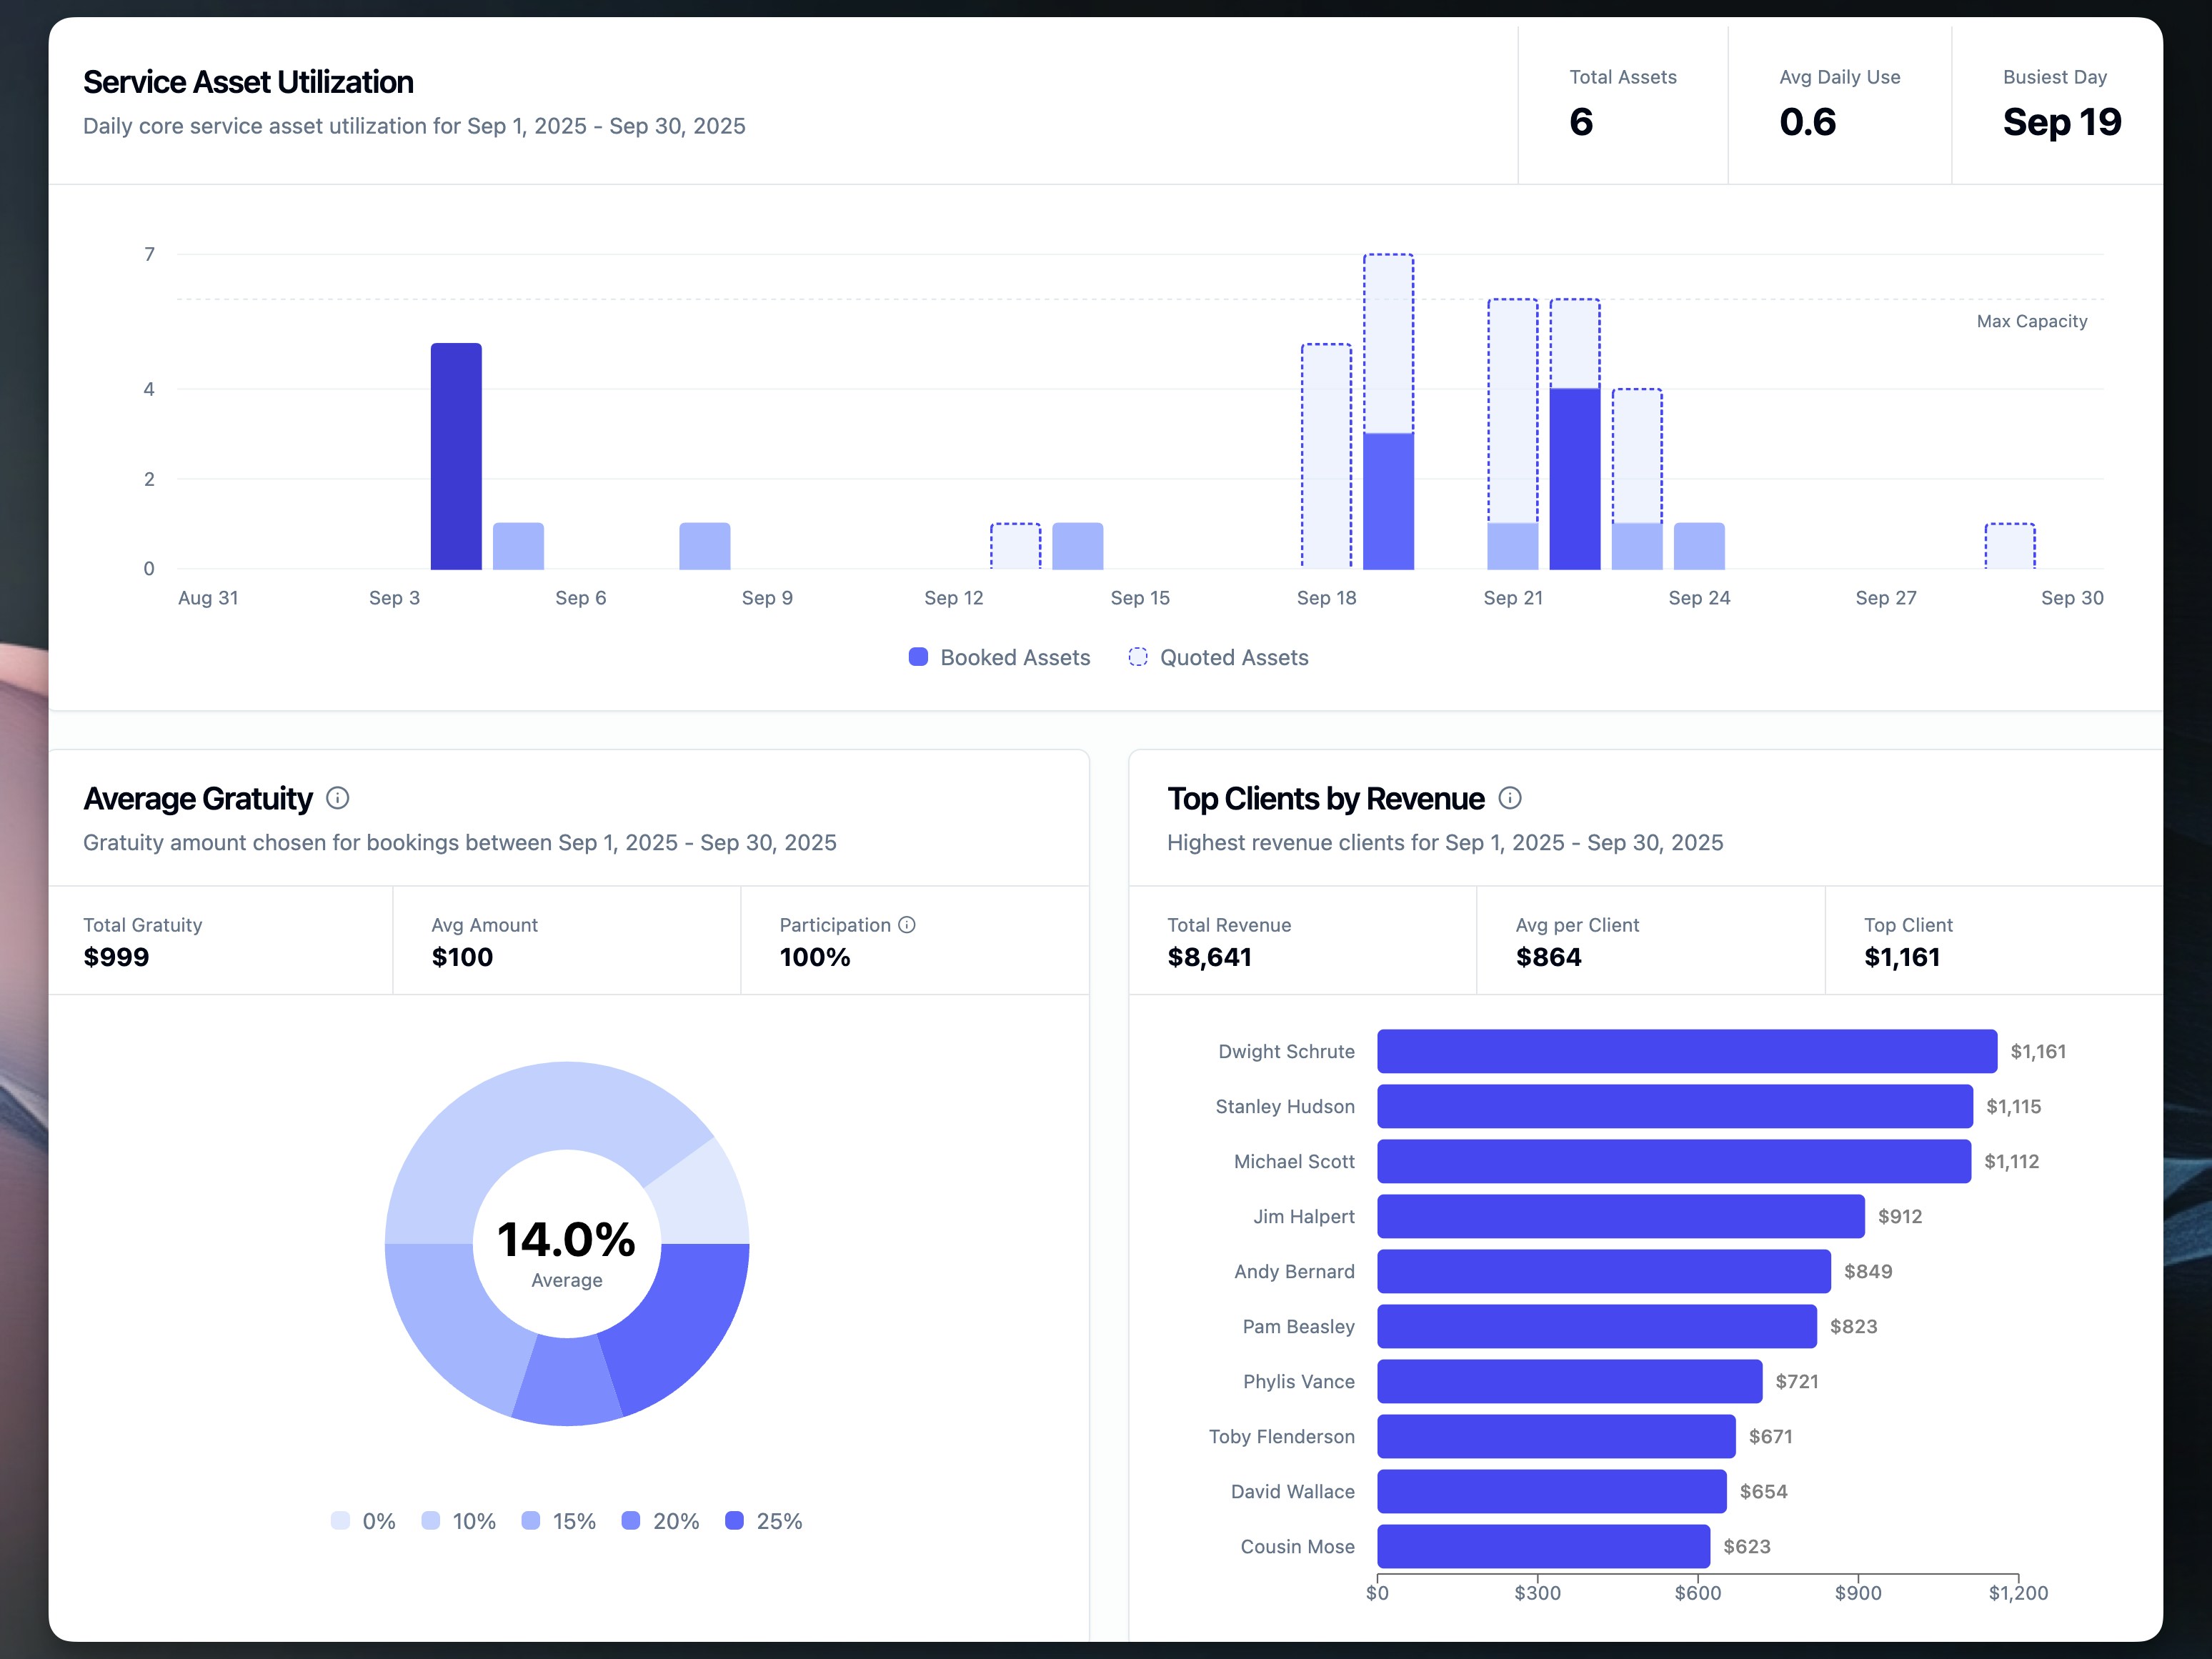
Monitor how efficiently your core service assets are being utilized over time. This visualization helps you:
* **Forecast busy periods**: Identify patterns in asset usage to predict peak demand
* **Optimize capacity**: Understand when you have available capacity for growth
* **Track quotes vs bookings**: See the relationship between quoted and confirmed events
**Key Metrics:**
* **Total Assets**: Number of core service resources in your inventory
* **Average Daily Use**: Mean number of assets in use per day
* **Busiest Day**: Peak utilization date in the selected period
The chart displays:
* **Booked Assets** (solid bars): Confirmed bookings
* **Quoted Assets** (dashed outline): Pending quotes
* **Max Capacity Line**: Your total available resources
Asset utilization is based on core service resources marked as "Affects Quote Availability" in your Resources settings.
### Average Gratuity
Analyze gratuity patterns and customer tipping behavior across your bookings. This report helps you:
* **Understand tipping trends**: See how customers respond to gratuity options
* **Optimize gratuity settings**: Adjust percentage options based on customer preferences
* **Track total tips**: Monitor gratuity revenue over time
**Key Metrics:**
* **Total Gratuity**: Combined gratuity amount from all bookings
* **Average Amount**: Mean gratuity per booking with tips
* **Participation Rate**: Percentage of customers choosing to add gratuity
The pie chart shows the distribution of gratuity percentages selected by customers, with darker colors representing higher tip percentages.
This report only includes gratuity selected through booking forms. Tips added directly to invoices or via service charges are tracked separately.
### Top Clients by Revenue
Identify your most valuable customers and understand revenue concentration. This report helps you:
* **Recognize VIP clients**: Focus retention efforts on high-value relationships
* **Analyze revenue distribution**: Understand customer concentration risk
* **Track client lifetime value**: Monitor revenue trends from repeat customers
**Key Metrics:**
* **Total Revenue**: Combined revenue from top 10 clients
* **Average per Client**: Mean revenue across displayed clients
* **Top Client Revenue**: Highest individual client contribution
The horizontal bar chart displays your top 10 clients ranked by total invoice amount, including all taxes, discounts, and service charges.
### Sales Tax
See total sales, taxable amounts, and tax collected per tax rate for any date range. [View the Sales Tax report guide →](/reports/sales-tax)
### Additional Metrics
The Reports page also displays essential business statistics:
* **Total Events**: Number of bookings in the period
* **Total Guests**: Combined guest count across all events
* **Event Duration**: Total hours of event time
* **Service Hours**: Customer-facing staff time
* **Shift Hours**: Total scheduled staff hours including setup/breakdown
* **Percent Paid**: Percentage of invoices fully paid
* **Period comparisons**: Trend indicators vs previous period
## Filtering Reports
All reports can be filtered to show specific data:
### Date Range
Select custom date ranges or use presets:
* Today
* Last 7 days
* Last 30 days
* Custom range
### Location Filter
For multi-location businesses, filter reports by:
* All locations (combined)
* Individual location
* Multiple selected locations
Use date range filters to compare seasonal trends, identify growth periods, and plan for future capacity needs.
## Best Practices
### Regular Review
* Review reports weekly to identify trends early
* Compare month-over-month metrics for growth tracking
* Export data monthly for historical records
### Data-Driven Decisions
Use report insights to:
* **Adjust pricing**: Increase rates during high-demand periods
* **Plan inventory**: Add resources before busy seasons
* **Focus marketing**: Target customer segments with highest value
* **Improve operations**: Optimize staffing based on actual usage
### Client Relationship Management
* Reach out to top clients with special offers
* Monitor changes in client spending patterns
* Identify at-risk relationships from declining bookings
Historical data accuracy depends on maintaining consistent resource settings. Changes to resource availability settings will affect future reports but not past data.
## Related Articles
* [Managing Resources](/resources) - Configure service assets
* [Understanding Invoices](/invoices) - Track payment data
* [Contacts](/contacts) - Convert prospects to clients
## Accessing Reports
Navigate to **Reports** from the main navigation menu to access your analytics dashboard.
## Available Reports
### Service Asset Utilization
Monitor how efficiently your core service assets are being utilized over time. This visualization helps you:
* **Forecast busy periods**: Identify patterns in asset usage to predict peak demand
* **Optimize capacity**: Understand when you have available capacity for growth
* **Track quotes vs bookings**: See the relationship between quoted and confirmed events
**Key Metrics:**
* **Total Assets**: Number of core service resources in your inventory
* **Average Daily Use**: Mean number of assets in use per day
* **Busiest Day**: Peak utilization date in the selected period
The chart displays:
* **Booked Assets** (solid bars): Confirmed bookings
* **Quoted Assets** (dashed outline): Pending quotes
* **Max Capacity Line**: Your total available resources
Asset utilization is based on core service resources marked as "Affects Quote Availability" in your Resources settings.
### Average Gratuity
Analyze gratuity patterns and customer tipping behavior across your bookings. This report helps you:
* **Understand tipping trends**: See how customers respond to gratuity options
* **Optimize gratuity settings**: Adjust percentage options based on customer preferences
* **Track total tips**: Monitor gratuity revenue over time
**Key Metrics:**
* **Total Gratuity**: Combined gratuity amount from all bookings
* **Average Amount**: Mean gratuity per booking with tips
* **Participation Rate**: Percentage of customers choosing to add gratuity
The pie chart shows the distribution of gratuity percentages selected by customers, with darker colors representing higher tip percentages.
This report only includes gratuity selected through booking forms. Tips added directly to invoices or via service charges are tracked separately.
### Top Clients by Revenue
Identify your most valuable customers and understand revenue concentration. This report helps you:
* **Recognize VIP clients**: Focus retention efforts on high-value relationships
* **Analyze revenue distribution**: Understand customer concentration risk
* **Track client lifetime value**: Monitor revenue trends from repeat customers
**Key Metrics:**
* **Total Revenue**: Combined revenue from top 10 clients
* **Average per Client**: Mean revenue across displayed clients
* **Top Client Revenue**: Highest individual client contribution
The horizontal bar chart displays your top 10 clients ranked by total invoice amount, including all taxes, discounts, and service charges.
### Sales Tax
See total sales, taxable amounts, and tax collected per tax rate for any date range. [View the Sales Tax report guide →](/reports/sales-tax)
### Additional Metrics
The Reports page also displays essential business statistics:
* **Total Events**: Number of bookings in the period
* **Total Guests**: Combined guest count across all events
* **Event Duration**: Total hours of event time
* **Service Hours**: Customer-facing staff time
* **Shift Hours**: Total scheduled staff hours including setup/breakdown
* **Percent Paid**: Percentage of invoices fully paid
* **Period comparisons**: Trend indicators vs previous period
## Filtering Reports
All reports can be filtered to show specific data:
### Date Range
Select custom date ranges or use presets:
* Today
* Last 7 days
* Last 30 days
* Custom range
### Location Filter
For multi-location businesses, filter reports by:
* All locations (combined)
* Individual location
* Multiple selected locations
Use date range filters to compare seasonal trends, identify growth periods, and plan for future capacity needs.
## Best Practices
### Regular Review
* Review reports weekly to identify trends early
* Compare month-over-month metrics for growth tracking
* Export data monthly for historical records
### Data-Driven Decisions
Use report insights to:
* **Adjust pricing**: Increase rates during high-demand periods
* **Plan inventory**: Add resources before busy seasons
* **Focus marketing**: Target customer segments with highest value
* **Improve operations**: Optimize staffing based on actual usage
### Client Relationship Management
* Reach out to top clients with special offers
* Monitor changes in client spending patterns
* Identify at-risk relationships from declining bookings
Historical data accuracy depends on maintaining consistent resource settings. Changes to resource availability settings will affect future reports but not past data.
## Related Articles
* [Managing Resources](/resources) - Configure service assets
* [Understanding Invoices](/invoices) - Track payment data
* [Contacts](/contacts) - Convert prospects to clients